Piktochart
In my role as a coordinator, I am responsible for doing some of the marketing. Yet, keeping up with the latest social media changes is not always an easy task. With that being said, I must put my creativity to work when it comes to designing marketing tools as well as other materials as needed.
A while ago I learned about Piktochart through a colleague. Piktochart is a web application that supports non-designers create easy infographics. These are visual designs that help to explain complicated data in a more simplistic way. My best way of explaining this, crunch words into graphics.
The app easily allows to create infographics without the need of learning another software like Photoshop or Adobe Illustrator. Definitely, requires minimum effort to produce appealing, high quality graphics. It is a one-step sign up process, allowing you to create a free account, granting instant access and easy to use. You may find infographics, presentations, posters, and reports. You may customize the font, graphics, charts, color of the infographics allowing you to save and PUBLISH to any of your social networks, but you may also download as an image. While there are numerous free templates, you may purchase additional features as well. So far, I haven’t had the need of making a purchase. It also allows you to upload your own images.
As many sites and apps, free video tutorials are available.
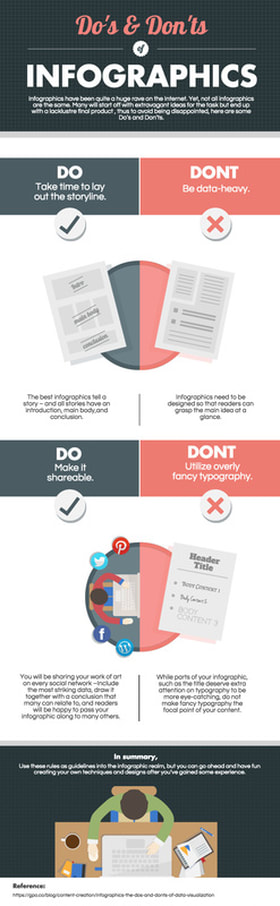
In the same way we are learning on designing effective website (Cunningham, Ch8) I have learned that it is a similar process in designing these infographics and similar steps apply as to web site. For instance:
Even though, often times these are published on our website and shared via email, I also distribute these among parent groups. As educators, we have to keep in mind that not ALL parents have access to social media or the internet. Through Piktochart, I am able to distribute the main message captivating their attention.
Nonetheless, information may be shared on Twitter, LinkedIn, Facebook, Instagram, Google+. The combinations are endless, only two things can happen when you employ this tactic:
A while ago I learned about Piktochart through a colleague. Piktochart is a web application that supports non-designers create easy infographics. These are visual designs that help to explain complicated data in a more simplistic way. My best way of explaining this, crunch words into graphics.
The app easily allows to create infographics without the need of learning another software like Photoshop or Adobe Illustrator. Definitely, requires minimum effort to produce appealing, high quality graphics. It is a one-step sign up process, allowing you to create a free account, granting instant access and easy to use. You may find infographics, presentations, posters, and reports. You may customize the font, graphics, charts, color of the infographics allowing you to save and PUBLISH to any of your social networks, but you may also download as an image. While there are numerous free templates, you may purchase additional features as well. So far, I haven’t had the need of making a purchase. It also allows you to upload your own images.
As many sites and apps, free video tutorials are available.
In the same way we are learning on designing effective website (Cunningham, Ch8) I have learned that it is a similar process in designing these infographics and similar steps apply as to web site. For instance:
- Deciding on who the audience will be (the same as web-page development, it is important to keep our intended audience in mind)
- Choosing appropriate visual metaphor or theme
- Breaking up information into sized chunks
- Design each page
Even though, often times these are published on our website and shared via email, I also distribute these among parent groups. As educators, we have to keep in mind that not ALL parents have access to social media or the internet. Through Piktochart, I am able to distribute the main message captivating their attention.
Nonetheless, information may be shared on Twitter, LinkedIn, Facebook, Instagram, Google+. The combinations are endless, only two things can happen when you employ this tactic:
- Targeted audience may share it again on the second network. This is likely because they like it. Or simply pass it on to others,
- They may follow you on the second network. Now, you connect to high-value contacts on several networks, not just one.
Subscribe
Source: Piktochart
